As talent acquisition specialists, you have a direct hand in your company’s future by how effectively you attract and engage candidates. With so much at stake, you should take every opportunity to improve your talent acquisition outcomes with dedicated strategies.
In this guide, we’ll break down exactly what talent acquisition is, provide strategies to inspire you, explain how to launch your own strategy, and review examples of companies that have successfully implemented their own talent acquisition approaches.
- Talent acquisition vs. recruitment
- What is a talent acquisition strategy?
- 7 key talent acquisition strategies
- What you need for a talent acquisition strategy
- Talent acquisition strategy in practice

Talent acquisition vs. recruitment
Before we go any further, you should understand what talent acquisition is—and what it isn’t. According to Jobvite, here are some key distinctions between talent acquisition and recruitment—two terms that get erroneously interchanged:
- Talent acquisition is a strategic, long-term process that takes overall hiring and business goals into account. It often concerns big-picture changes, like workplace culture shifts, internal mobility structure, and candidate relationship-building.
- Recruitment is a short-term process that focuses on fulfilling immediate hiring needs.
Essentially, recruitment is a sprint while talent acquisition is a marathon. Both are important to the health of your hiring program, but honing your talent acquisition strategy can improve recruitment as well.
What is a talent acquisition strategy?
A talent acquisition strategy is a plan developed by hiring teams outlining how the business will leverage its unique assets and strengths to improve its talent acquisition. Talent acquisition itself is strategic, but for the purposes of this article, we’ll focus on specific tactics you can use to get ahead of competitors.
7 key talent acquisition strategies
No two talent acquisition strategies look the same. However, there are notable similarities between the strategies of recruiting and hiring programs at high-growth companies that help them excel in attracting loyal, motivated, and qualified talent. Let’s review some talent acquisition strategies to inspire your own planning:

1. Use informal outreach channels
If your team already leverages nuanced talent-sourcing networks and job fairs, but you aren’t getting the results you expect, it’s time to diversify your channels. Informal hiring channels are more popular now than ever as Millennials and members of Gen Z increasingly fill talent pools. Consider sourcing applicants from the following communication channels:
- Social media
- Employee referrals
- Digital job boards
- Industry-specific online forums
- Podcasts and blogs
You should still be professional when communicating with prospects, but these channels lend themselves to a more conversational tone, which can humanize your business and help prospects feel at ease.
2. Engage prospects with personalized messaging
The best way to keep prospects interested in your program is to create communications that resonate with them. To pique your candidates’ interest, ensure your messages are personalized with the following information:
- Name
- The role they’re applying for
- Preferred communication channel
- Progress updates based on their hiring funnel position
- Tailored content to their desired role
- Messages from current team members in the role
Tailor your exact personalization criteria based on the role, your hiring goals, and your applicant tracking system’s (ATS) capabilities.
3. Refine candidate-sourcing quotas
Many talent acquisition professionals use quotas to properly regulate and set goals for their hiring process. However, if quotas are too broad or narrow, they won’t be helpful and could make hiring less effective. Revisit your hiring quotas and refine them based on:
- Current business goals and financial standing
- Role specificity/experience required
- Hiring market conditions
- Criticism from different departments
- Competitor benchmarking
- Candidate feedback
As with all other major hiring decisions, your existing hiring data is key for establishing the right quotas. That information, along with your aspirations for your talent acquisition strategy, will point you to the key performance indicators (KPIs) that you need to succeed.
4. Prioritize candidate experience (CX)
Your hiring team forms the first impression of your company to candidates, so you need to exceed their expectations from the get-go. That’s why optimizing CX is such a crucial part of building a lasting and effective talent acquisition strategy. Here are some ways you can prioritize CX:
- Use a quality ATS like Lever that streamlines the application process.
- Respond to communications promptly.
- Be transparent about hiring expectations and timelines.
- Integrate people from the team they’re interviewing with into the process.
- Connect them with other candidates.
The best way to understand what’s working and what needs to be improved is to ask candidates directly. Send surveys throughout the recruitment process so you can pivot in the right direction.
5. Automate core recruitment processes
While much of recruitment and talent acquisition is about building genuine human connections, remember that you can cut tedious manual tasks from your workload entirely with the right technology. Here are some of the key ATS features you should look for:
- Intuitive user interface (UI)
- Quick resume review
- Ability to post to job boards
- Interview scheduling
- Communication templates
- Candidate data profiles
- Integrations with recruiting tools
The top ATS on the market strike the right balance between automation and personalization, allowing you to preserve a human touch while recruiting more efficiently.
6. Prioritize diversity, equity, and inclusion (DEI) initiatives
DEI is a popular recruitment topic, and for good reason—diverse teams are 87% better at making decisions and can increase revenue by 19%. However, you can only access this competitive edge by creating a dedicated DEI talent acquisition strategy. Also, prioritizing DEI allows you to build an office environment where everyone feels welcomed and represented, which can improve employee engagement and reduce turnover.
To improve your company’s approach to DEI, start by asking your employees their opinions on your work environment’s diversity. During recruitment, you should use an ATS that mitigates unconscious bias with Bias Blocking technology. Take it a step further by partnering with a DEI consultant who can analyze your current standing and provide guidance for improvement.
7. Leverage analytics to scale hiring
Talent acquisition is by nature a long-term process that requires consistent iteration over time. Picking KPIs based on your talent acquisition strategy is crucial for making everything come together. JazzHR recommends considering the following metrics:
- Application Completion Rate
- Funnel Conversion Rate
- Candidate Feedback Scores
- Average Cost of Hire
- Quality of Hire
- Offer Acceptance Rate
- Employee Retention Rate
Once you’ve determined the KPIs that make the most sense for your business, ensure your ATS has customizable data fields so you can track and report on them effortlessly.
What you need for a talent acquisition strategy
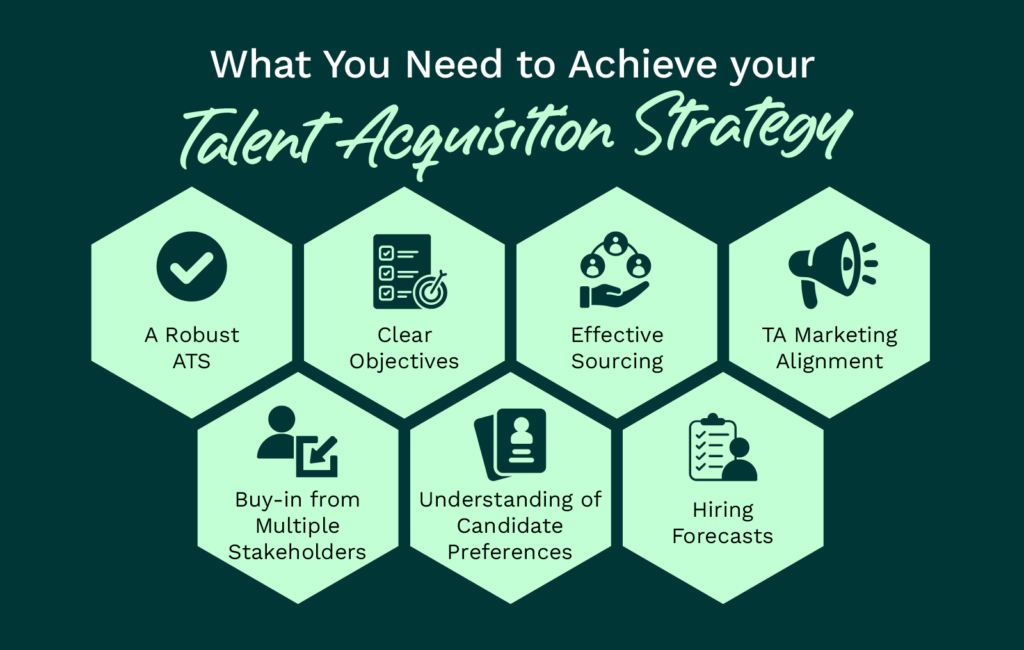
Ready to create a talent acquisition strategy that takes your company to the next level? Follow these easy steps to build a strong foundation:

- A robust ATS that streamlines your hiring tasks
- Clear objectives that guide your talent acquisition planning and execution
- Effective sourcing channels so you know where and how to engage prospects
- Marketing alignment that allows you to play to your company’s unique strengths
- Buy-in from multiple stakeholders so you’re all on the same page about priorities
- Understanding of candidate preferences so you can best target and engage them
- Hiring forecasts that can prepare you for anything
Once you take these elements into consideration, you can start filling in the details of your talent acquisition strategy that will set you apart from competitors. Try conducting a SWOT (strengths, opportunities, weaknesses, and threats) analysis so you have a holistic view of how to best use your assets.
Talent acquisition strategy in practice
Want to see examples of world-class TA programs from large-scale organizations? Here are the highly effective talent acquisition strategies executed by The Rise Awards winners. Note one of the key commonalities here—they all use Lever!
Improving Candidate Experience: Spreetail
Spreetail, an ecommerce solution, knew it could improve its candidate experience by:
- Sending CX surveys to potential candidates so it could track and grow its Net Promoter Score (NPS)
- Revamping its candidate communication approach through training and practice (e.g., providing custom-tailored feedback to each individual that Spreetail interviewed)
The company had collected candidate feedback for years, but it wasn’t until recently that it used NPS to assess its CX performance. As for its communication strategy, the recruiters learned via CX surveys that rejected leads wanted more feedback about the hiring decision.
By offering personalized feedback, Spreetail gradually grew its NPS score. Moreover, it maintained long-term relationships with passed-on talent to consider them for future roles. These strategies paired with their use of Lever allowed them to hire over 1,000 people and continue scaling their hiring outcomes with their business.

Improving DEI talent acquisition strategy: Talking Rain
Talking Rain, a Washington-based beverage company, knew it needed to hire for “diversity of thought.” Why? To continue to scale globally and strengthen its company culture.
So, its talent acquisition team examined its DEI analytics using Lever and found that their hiring historically skewed white and male, with many of those particular hires coming from referrals.
After examining regional and national hiring trends, Talking Rain’s recruiters knew its best bet to build a more diverse workforce was to update job descriptions and where listings were posted.
The company ultimately shifted from the traditional referral model to a more inclusive one, and the results were promising. The percentage of female applicants grew from 22% in 2020 to 50% in 2021, and the number of BIPOC candidates rose from 32% in 2020 to 41%.
Improving Candidate Relationship Management Excellence: Atlassian
Atlassian, which produces tech solutions for software providers and developers, knows the value of staying in touch with its pool of qualified candidates. The rapidly scaling business’s goal was clear: build a “Talent Community” that allowed its talent acquisition team to better engage with talent based on the specific roles they want to pursue.
Based on their goals, Atlassian pivoted their nurturing efforts. Talent pool members could opt into a bi-monthly newsletter and email thread with content on topics like remote work and employee support called “Talent Community.”
As their Talent Community grew, the Atlassian talent acquisition team, along with hiring managers and its HR department, acquired data that informed their ideal lead profile and identified good fits for open roles.
Ultimately, the community grew 47.5% annually and had 13,000 active members. Atlassian managed this booming community using Lever to send 20,000-plus nurture messages to members, with an average open rate of 62%. Nearly 300 members have been hired thanks to their efforts and tools.
Remember, your talent acquisition strategy will take ample time and resources to fully form. Just ensure you engage the right teams, take data and feedback into account, and use the best ATS.
Learn how you can execute a highly successful talent acquisition strategy like these companies with our ATS + CRM solution. Schedule a LeverTRM demo today.


